Interactions & Editing
How to navigate and edit the map with mouse, trackpad, and keyboard — on Linux, Windows, and macOS.
Moving things around the map
Dragging nodes needs no setting — but it only works in the panel editor. On a saved dashboard the map is deliberately inert, so a viewer can never nudge the topology by accident. There is no "enable dragging" option to look for; opening the editor is the switch.
- Open the dashboard and hover the panel.
-
Press
e, or open the panel menu (⋮) → Edit.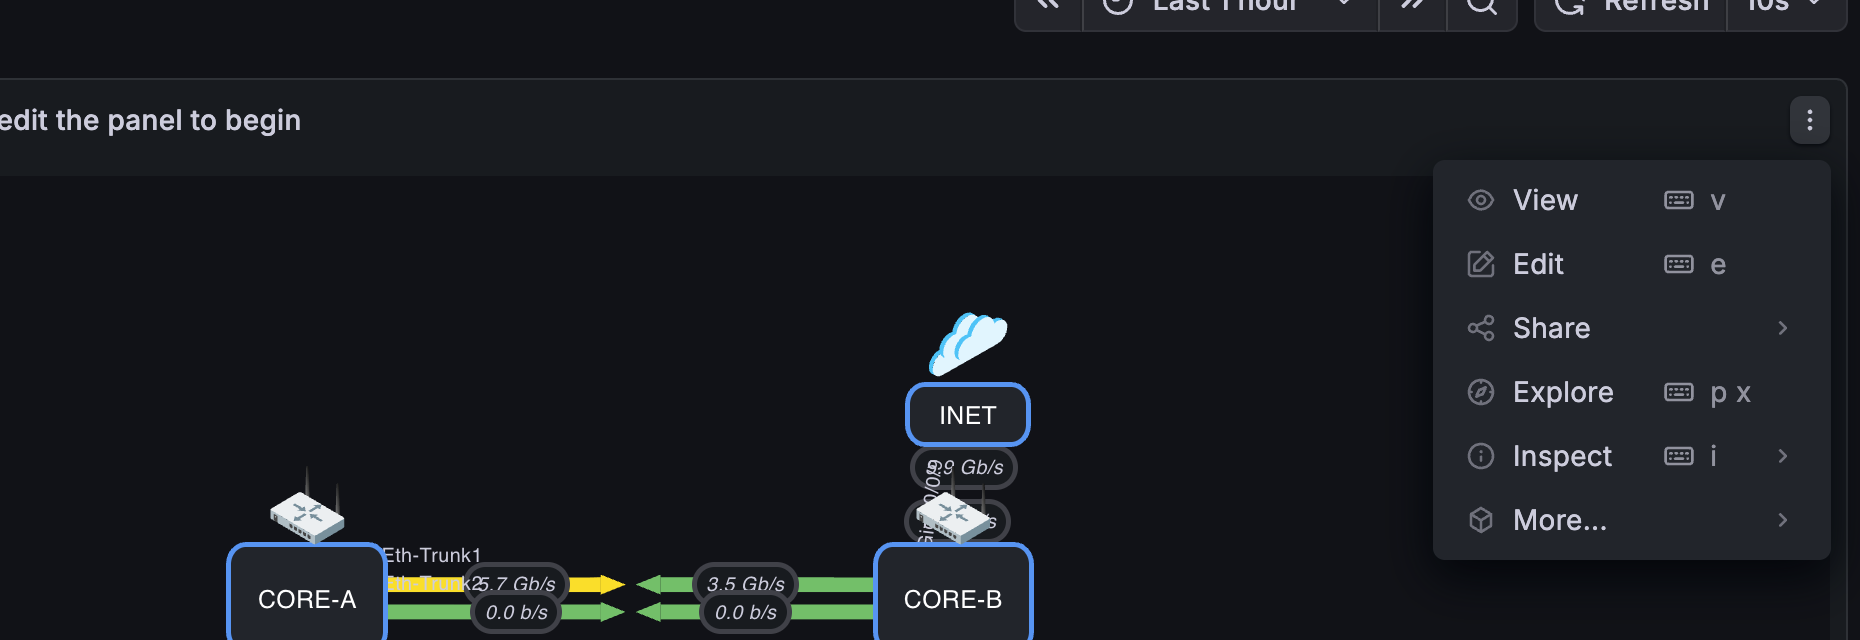
The panel menu lists Edit with its shortcut. This is the only "switch" there is — there is no drag setting in Panel Options.
-
Drag nodes (and VIAs, and any other handle) directly on the canvas.
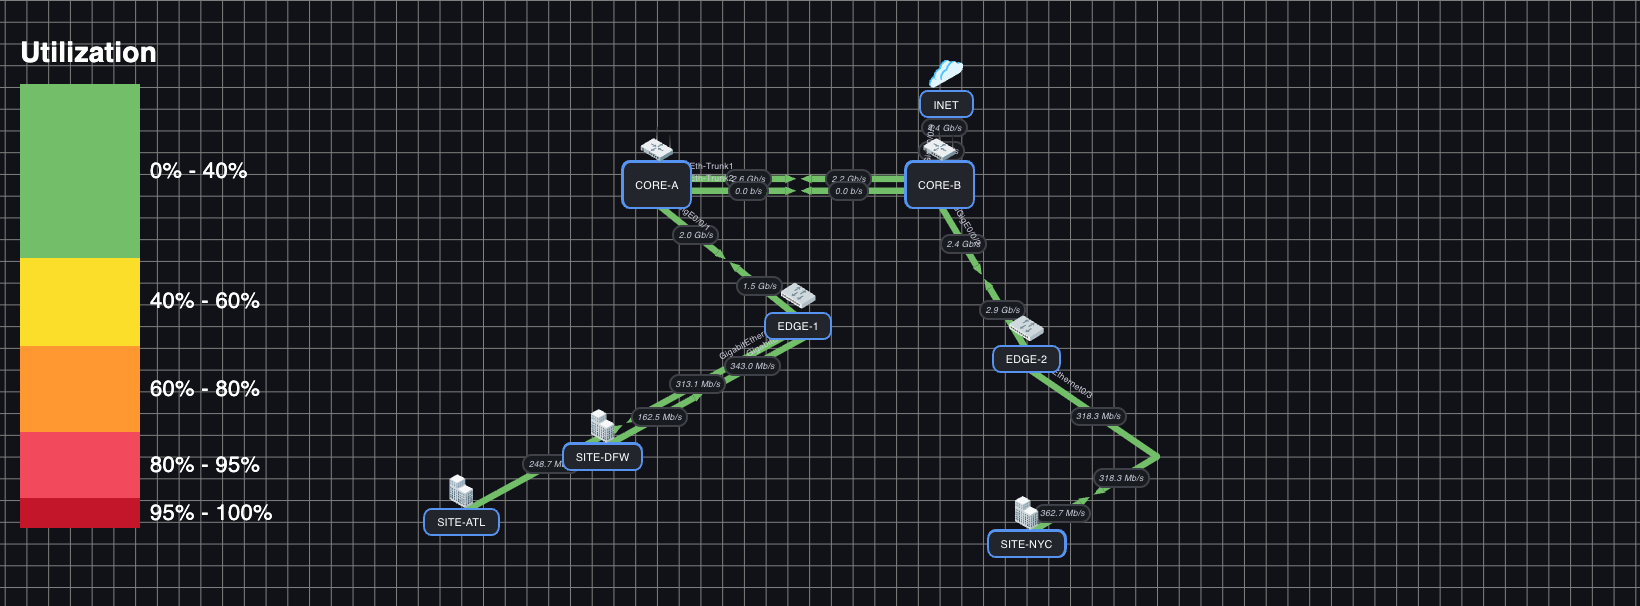
The same map in the editor. Grid guides are drawn behind the nodes here because Grid Guides is on, so you can see what a drag is snapping to — they appear only while editing, never on the saved dashboard.
-
Click Back to dashboard, then Save dashboard — positions are stored in the panel options, so nothing is kept until you save.
If dragging does nothing, you are almost certainly still in view mode — check for the panel-editor toolbar at the top of the screen.
Somewhere to practise
The testing environment ships WAN Demo — Drag & Arrange (editing playground): a deliberately badly-arranged copy of the WAN map, with three nodes parked where they crowd their neighbours and drag their links across each other. Nothing is wrong with its data — only the layout — so it is a safe place to try the gesture and watch it commit. Grid snapping and guides are already on.
Untangling a crowded map
Dragging a node is only one of the tools. When two links overlap, moving a node often just moves the problem; see Links for the two options aimed at it — Link Offset for links that share both endpoints, and waypoints for routing one link around an obstacle.
Edit mode vs. view mode
- Edit mode — the panel edit screen. You can add/move/delete nodes and links, drag VIAs, and zoom freely.
- View mode — a saved dashboard. Hover for tooltips; click nodes/links that have dashboard links. Nothing on the map can be moved.
Gestures that change the map are edit-mode only, so they cannot interfere with normal dashboard use.
Hover tooltips
Hover a link to see its usage, bandwidth, throughput percentage, and inbound/outbound history graphs. The legend uses your direction labels when configured. A node shows a tooltip when it has extra tooltip metrics configured.
Starting with v1.6.16, moving the pointer within the same link keeps the history chart steady while the tooltip follows the cursor. Incoming query data and dashboard time-range changes still update the graph; hovering another link shows that link's history. This improvement applies automatically to existing dashboards.
Use Tooltip settings to customize fonts, text/background colors, inbound/outbound line colors, and bandwidth scaling. Links without a usable time axis still show their text tooltip and omit the graph.
Gesture reference
Edit mode below means the gesture works only in the panel editor.
| Action | Linux / Windows | macOS | Mode |
|---|---|---|---|
| Move a node | Click-drag the node | Click-drag the node | Edit mode |
| Multi-select nodes | Ctrl+click each node, then drag any of them | ⌘ Cmd+click each node, then drag any of them | Edit mode |
| Add a VIA | Double-click a link | Double-click a link | Edit mode |
| Move a VIA | Drag the VIA | Drag the VIA | Edit mode |
| Delete a VIA | Right-click the VIA | Right-click (or Ctrl-click) the VIA | Edit mode |
| Pan the map | Ctrl+drag, Shift+drag, or middle-mouse drag | ⌘ Cmd+drag or Shift+drag | Both |
| Zoom | Scroll (edit mode); Shift+scroll (view mode) | Scroll (edit mode); Shift+scroll (view mode) | Both |
| Zoom & pan in view mode | Plain scroll / plain drag, when View Mode Zoom & Pan is enabled (Panel Options → Interaction & Labels); double-click resets | Same | View mode |
Dragging snaps to the grid when one is enabled (Panel Options → Grid), and a drag keeps tracking even if the cursor leaves the panel — release anywhere to commit it.
macOS
View Mode Zoom & Pan is off by default because plain scrolling over the panel would otherwise stop the dashboard page from scrolling. When enabled, each viewer's zoom/pan is local to their browser — it is never saved into the dashboard — and a double-click returns to the saved view.
macOS uses ⌘ Cmd where Linux/Windows use Ctrl (Ctrl-click is a right-click on a Mac). Zoom uses the dominant scroll axis, so a Mac's Shift+scroll (which the OS remaps to horizontal) still zooms.
Enabling View Mode Zoom & Pan
-
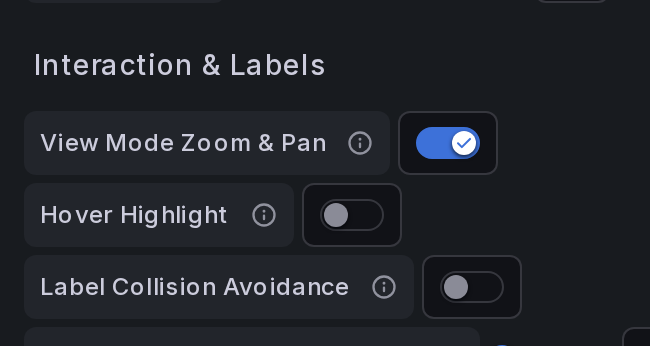
Edit the panel → in the options, open Interaction & Labels and turn on View Mode Zoom & Pan.
-
Save the dashboard.
- Back in view mode (not editing), over the panel: mouse wheel = zoom, left-drag = pan, double-click = reset to the saved view.
Each viewer's zoom/pan is local to their browser and is never written back to the dashboard. With the toggle off, viewers still zoom with Shift+wheel and pan with Shift/Ctrl/⌘-drag, and plain scrolling passes through to the dashboard page.
Editing VIAs on the canvas
VIAs (waypoints) let a link bend through intermediate points.
- Double-click anywhere on a link to insert a VIA at its midpoint. The link splits into two segments, and the A-side and Z-side query data are preserved on the correct halves.
- Drag the VIA handle to route the link where you want.
- Right-click a VIA to remove it — the two segments merge back into a single link.
Under the hood a VIA is a lightweight connection node; you can also toggle a node into a VIA with Use As Connection in the node's Advanced options.
Selecting and aligning multiple nodes
- Hold Ctrl (Linux/Windows) or ⌘ Cmd (macOS) and click nodes to build a selection.
- Drag any selected node to move the whole group.
- Enable the Grid (Panel Options) to snap positions for clean alignment.
Exporting a map
Open Panel options → Export:
- Export SVG — download the current map as an SVG image (icons are inlined). Useful for documentation and diagrams.
- Export JSON — download the full weathermap configuration as JSON. You can version-control it or import it into another panel.
Timeline scrubbing
If the Timeline Slider is enabled, drag the slider at the bottom of the panel to move through history; press Live to return to the latest state.
The WAN Demo — Incident Replay dashboard from the testing stack shows the difference. Live — the slider label reads Live (latest) and the map shows current values; everything here is healthy:
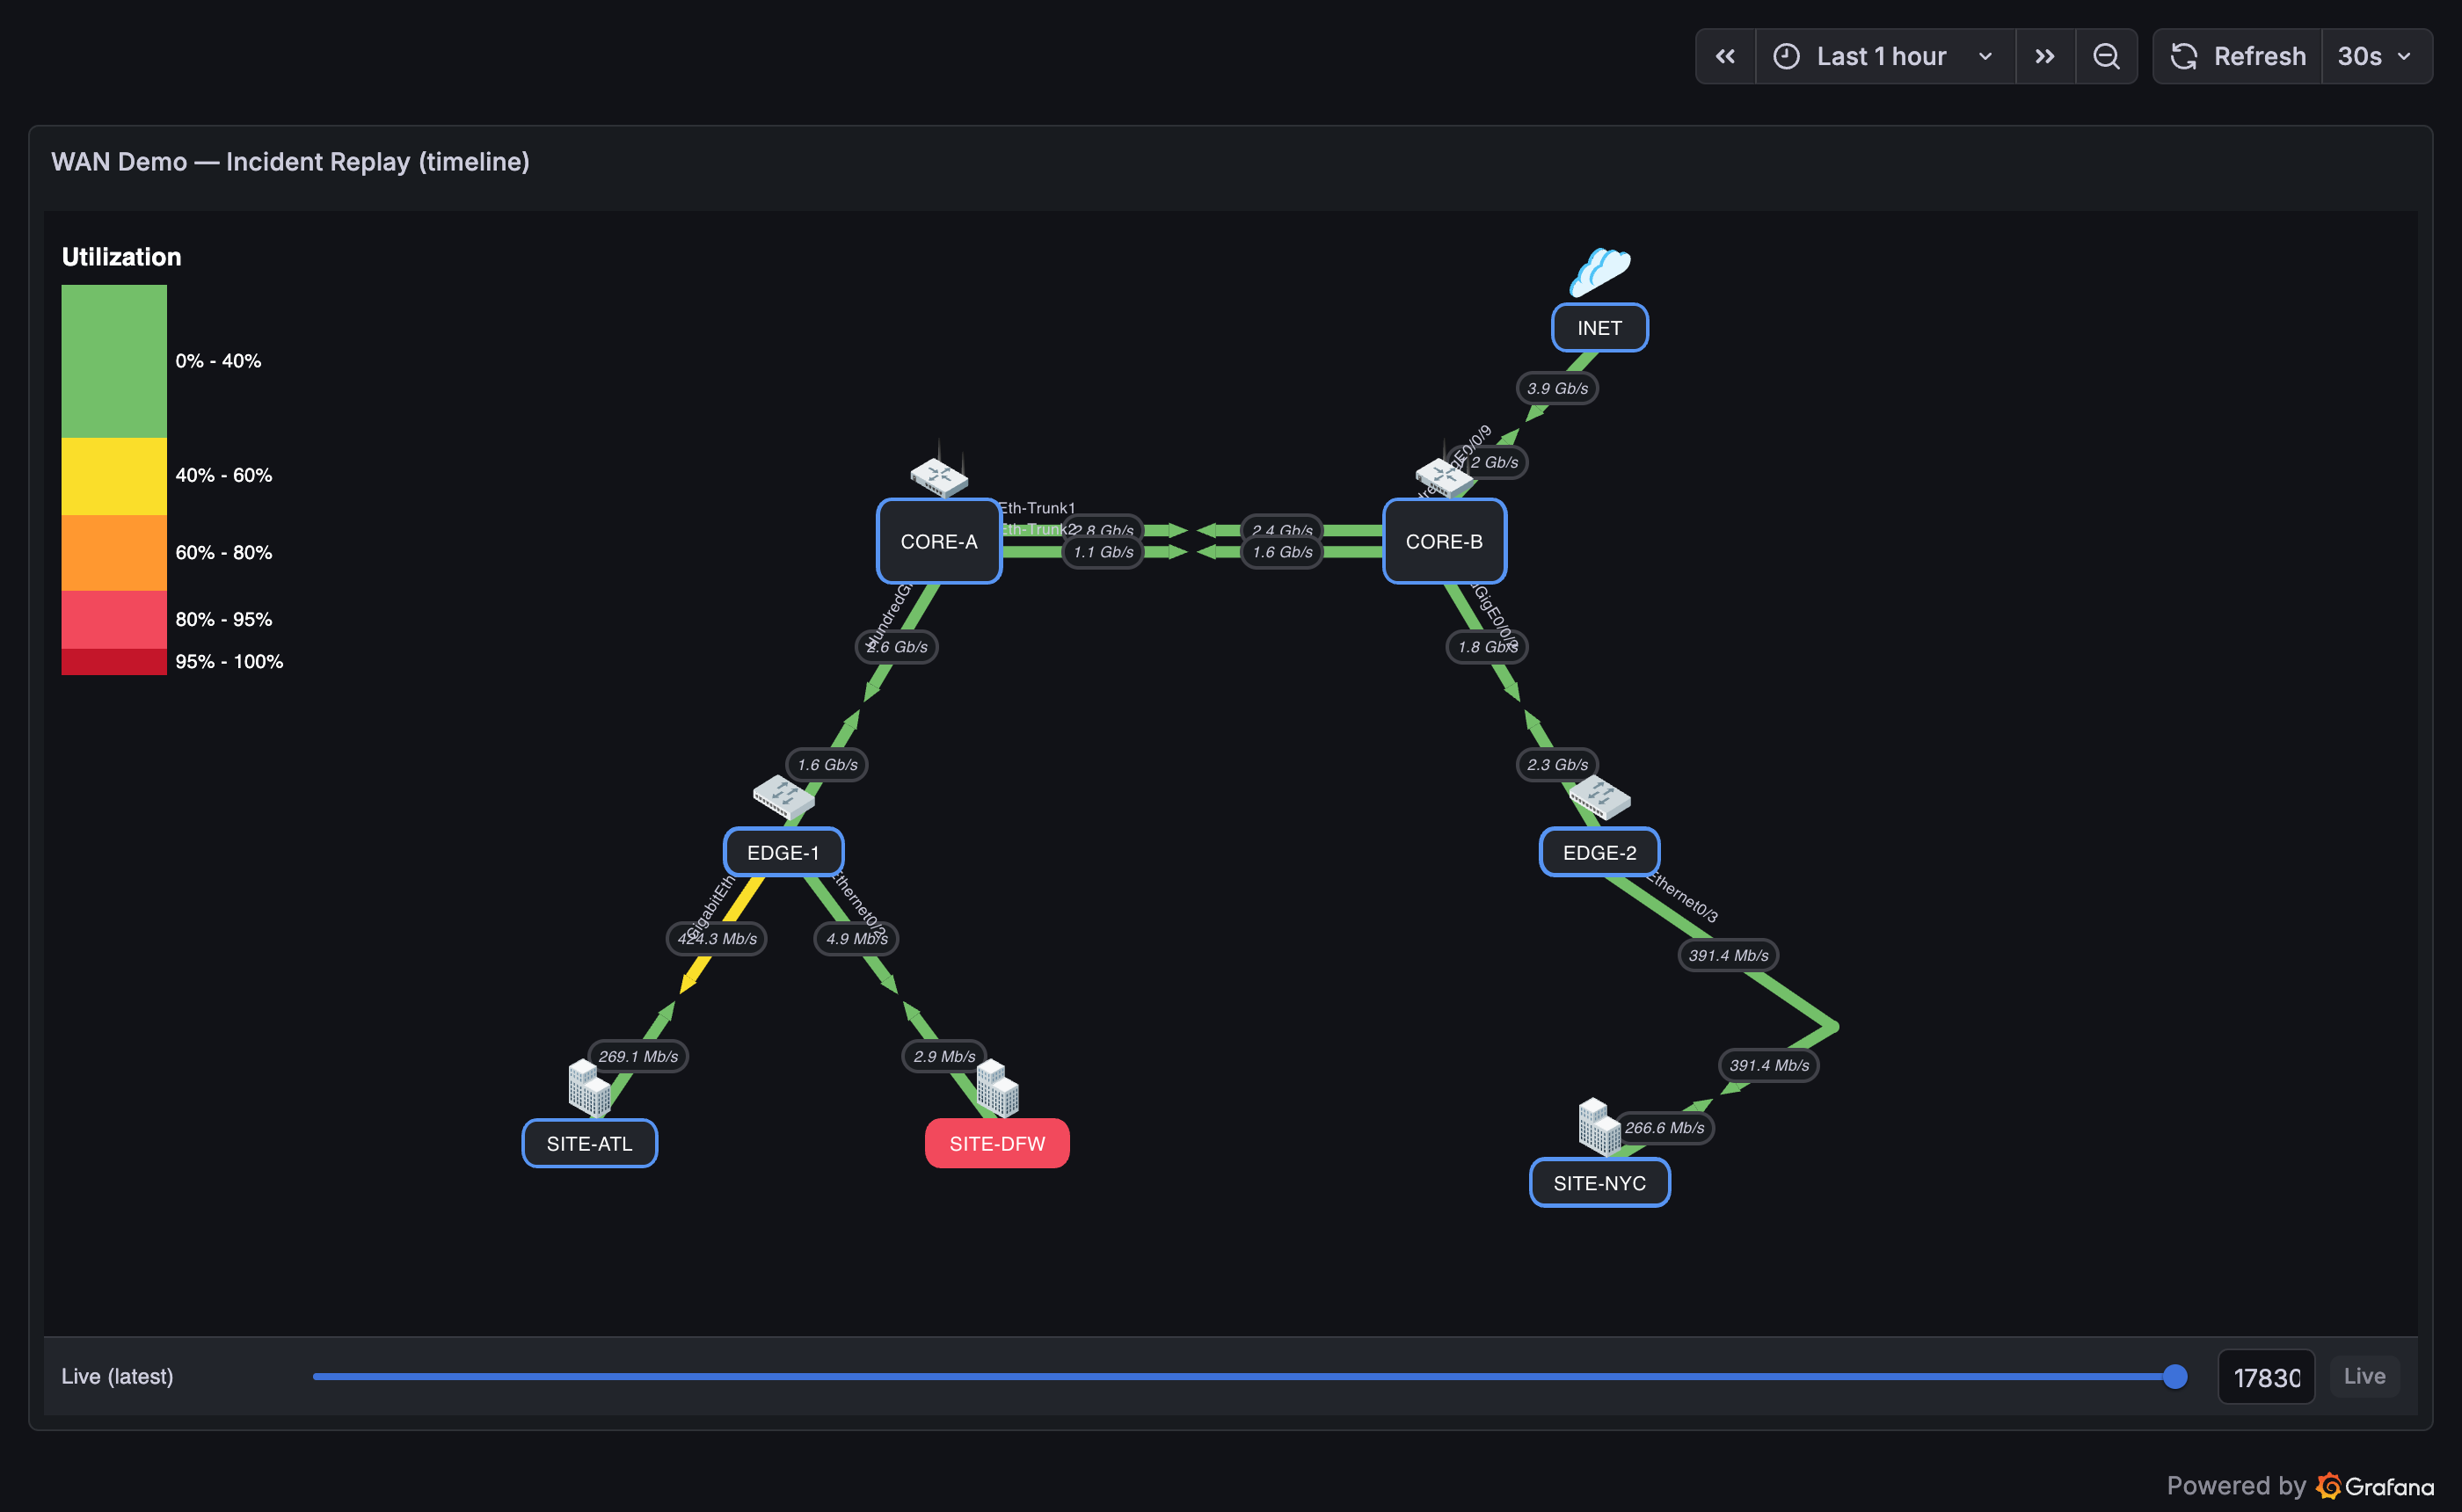
Scrubbed — the label shows the selected historical timestamp, and the map replays that moment: SITE-DFW's link has collapsed to a few Mb/s during its outage window. Press Live to snap back:
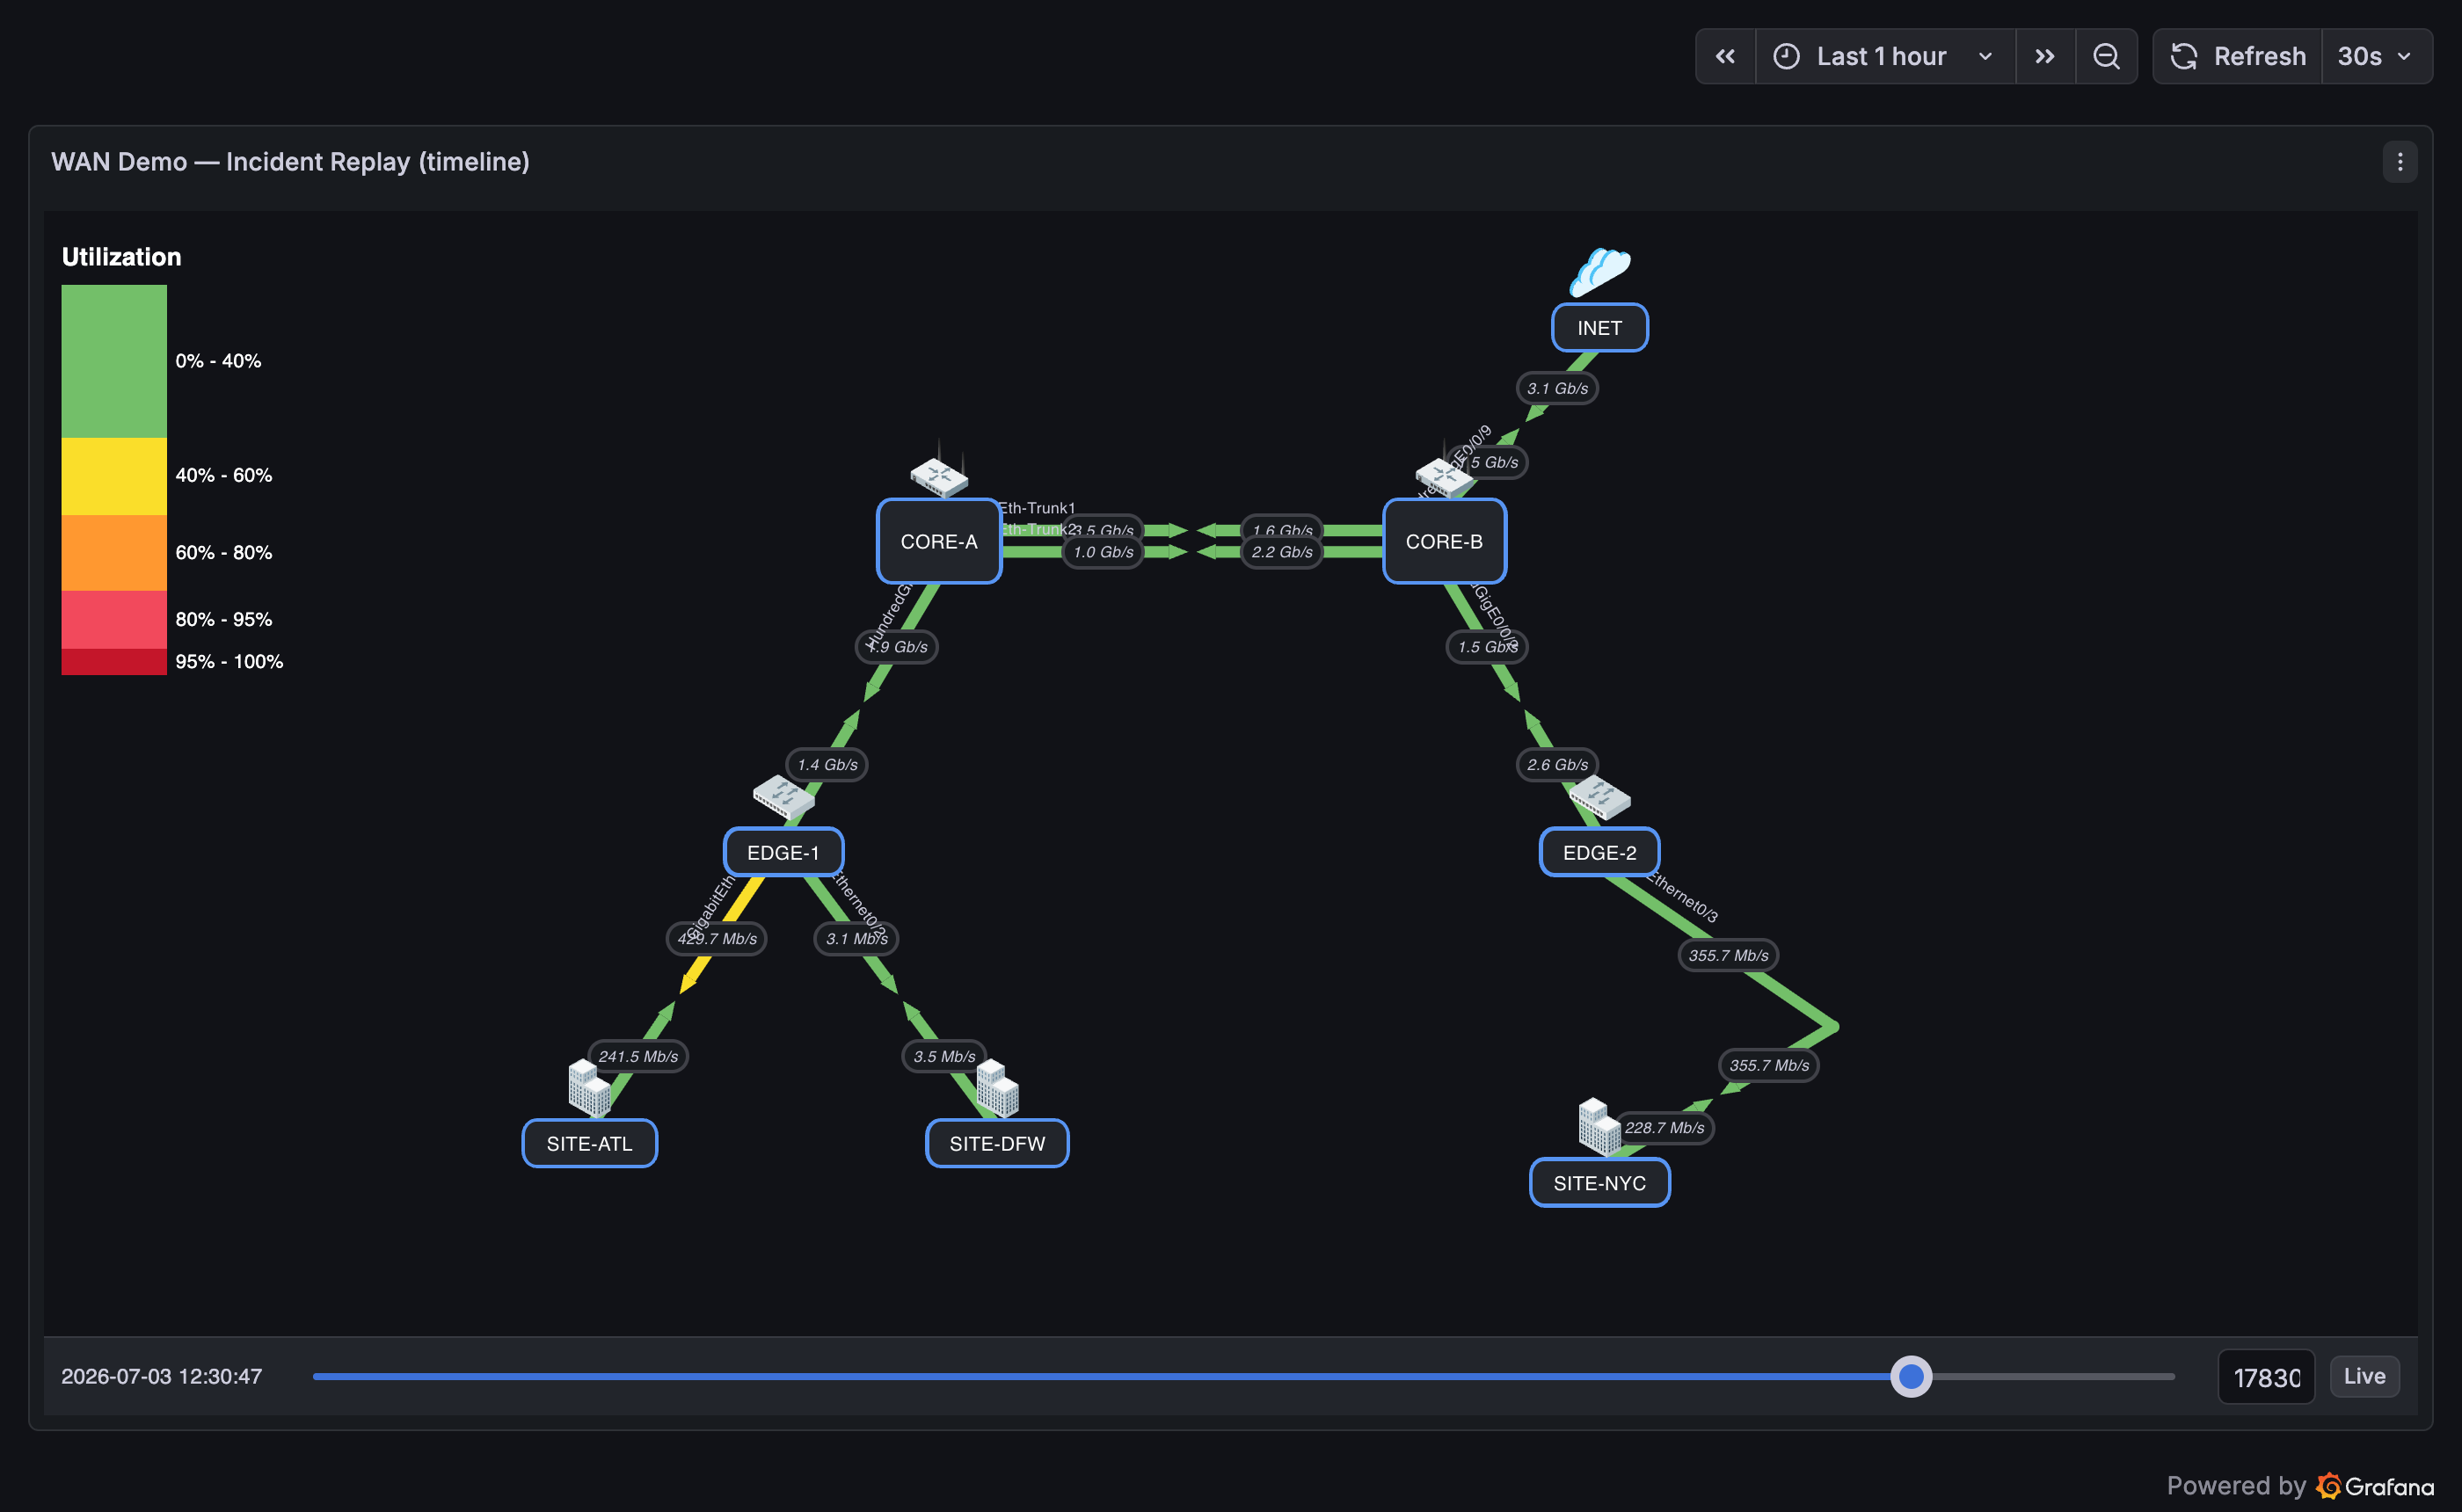
Only link values replay while scrubbing; node status coloring follows the latest value.