BGP Neighbor Status
A BGP session is a link, and a session's state is that link's status — so
Network Weathermap NG maps onto BGP almost 1:1, and arguably better than raw
bandwidth. Routers (or ASes) are nodes, BGP sessions are links, and a dropped
neighbor lights up exactly like a down interface: dashed line, ✕ badges, DOWN
label, blink.
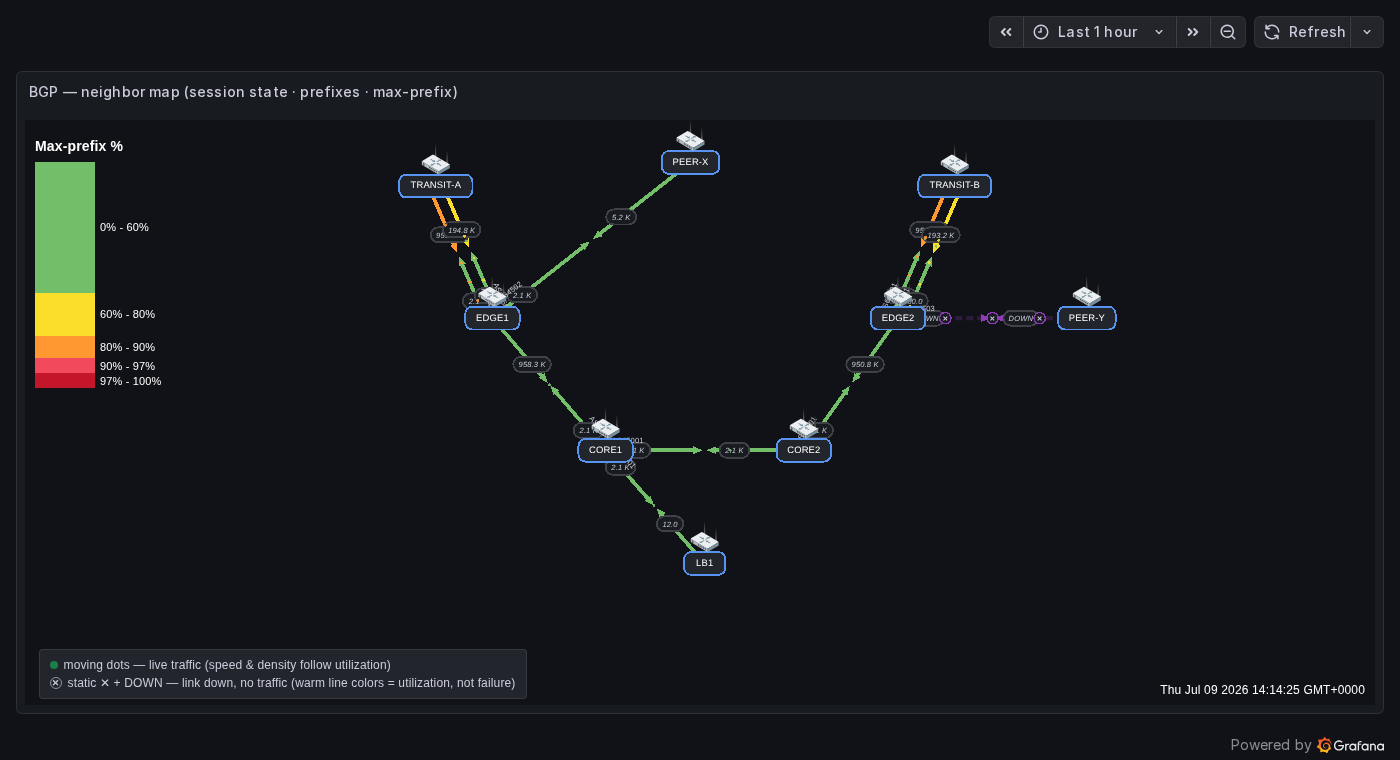
The demo WAN Demo — BGP Neighbor Map: iBGP core (green, headroom), eBGP transits (orange — near their max-prefix limit), and a dropped eBGP peer EDGE2↔PEER-Y (purple dashed, ✕ badges, DOWN). Prefix counts label every session.
This is a status map, not a route collector
It shows session health + prefix counts — the "is BGP healthy" question. It does not collect the route table. If you need full route contents, that's a different pipeline (BMP / a peering collector) — see collection methods.
How BGP maps onto the weathermap
| BGP concept | Weathermap element |
|---|---|
| Router / peer / AS | Node (label = hostname + ASN) |
| BGP session (eBGP / iBGP) | Link between the two nodes |
| Neighbor state (Established?) | Link Status Query → up/green vs down (dashed + ✕ + DOWN + blink) |
| Prefixes received / advertised | A-side / Z-side values (label = table size) |
| Max-prefix fullness | Link color (set side Bandwidth = the prefix limit) |
| Peer IP / ASN, uptime, flaps, state | Port label / Tooltip Extra Metrics |
| Per-router deep dive | Node Dashboard Link → the session-detail dashboard |
| IPv4 vs IPv6 to the same peer | Parallel links (Link Offset) |
The one gotcha: normalize the state to 1/0
The plugin treats a Status Query as 0 or absent = down, any non-zero = up.
BGP state metrics are enums — idle=1 … established=6 — so a session in
active (3) would read as "up" if bound raw. Collapse it with == bool 6
(ideally in a Prometheus recording rule):
# Link Status Query — 1 only when Established
cbgpPeer2State{...} == bool 6            # Cisco
jnxBgpM2PeerState{...} == bool 6         # Juniper
bgpPeerState{...} == bool 6              # standard BGP4-MIB / F5
The starter kit ships recording rules that produce a
vendor-neutral bgp_session_up (1/0) plus bgp_prefixes_received /
bgp_prefixes_advertised, so one set of dashboards works across a mixed fleet.
Choosing how to collect
What you can see depends on where in the router's BGP pipeline you tap — Adj-RIB-In (pre/post inbound policy), Loc-RIB (best paths), Adj-RIB-Out (what you advertise). A neighbor-status map only needs session health, so use a health-oriented tap:
| Intent | Method | For this map |
|---|---|---|
| Session health + prefix counts | gNMI / OpenConfig (push, structured, multi-AFI) | Best |
| Same, already running SNMP | SNMP BGP4-MIB / vendor MIB (pull) | Simplest |
| Full route contents (pre-policy) | BMP (RFC 7854) → collector → Kafka | Overkill |
| Live update feed | Peer a passive speaker (ExaBGP / GoBGP / BIRD) | Overkill |
| Snapshot / can't reconfigure | CLI scrape (NAPALM get_bgp_neighbors) |
Works, brittle |
| Offline archive | MRT dumps (RFC 6396) | Not live |
Reachability
SNMP is pull (exporter → device UDP/161); gNMI/BMP are device → collector over TCP. Across a firewalled enclave those flows must be permitted; in an air-gapped enclave you're limited to CLI snapshots or shipping dumps out-of-band.
Per-vendor sources (Cisco · Juniper · F5 · gNMI)
| Platform | SNMP (snmp_exporter) | gNMI / OpenConfig |
|---|---|---|
| Cisco IOS-XE/XR/NX-OS | CISCO-BGP4-MIB — cbgpPeer2State, cbgpPeer2AcceptedPrefixes, cbgpPeer2AdvertisedPrefixes (IPv4+IPv6) |
…/bgp/neighbors/neighbor/state/session-state, …/afi-safis/afi-safi/state/prefixes/received |
| Juniper Junos | BGP4-V2-MIB-JUNIPER — jnxBgpM2PeerState, jnxBgpM2PrefixInPrefixesAccepted |
same OpenConfig paths |
| F5 BIG-IP | standard BGP4-MIB — bgpPeerState (advanced routing / ZebOS, IPv4) |
— |
| Any (gNMI) | — | collect with gnmic → Prometheus output |
The standard BGP4-MIB (RFC 4273) is IPv4-unicast only — IPv6/other AFI-SAFI
needs the vendor MIB or gNMI.
Building the map
- Collect + normalize into
bgp_session_up/bgp_prefixes_*(kit rules). - Add a node per router; label it with the ASN.
- Add a link per session. In the link editor:
- Status Query =
bgp_session_up{node_name="…", peer="…", afi="…"}. - A Side Query = advertised, Z Side Query = received.
- A/Z Bandwidth # = the neighbor's max-prefix limit → the link warms as the peer fills its table (green → orange → red). For sessions with no limit, use a large reference so they read green.
- Status down color + blink, and add Tooltip Extra Metrics for session-state / uptime / flaps.
- Enable Traffic Animation on the panel so dropped sessions get the ✕ badges +
DOWNlabels (up sessions get gentle activity dots). - Point each node's Dashboard Link at your BGP session-detail dashboard.
Fleet overview & detail
Two companion dashboards ship in the kit and work for any fleet with the normalized metrics — no per-topology editing:
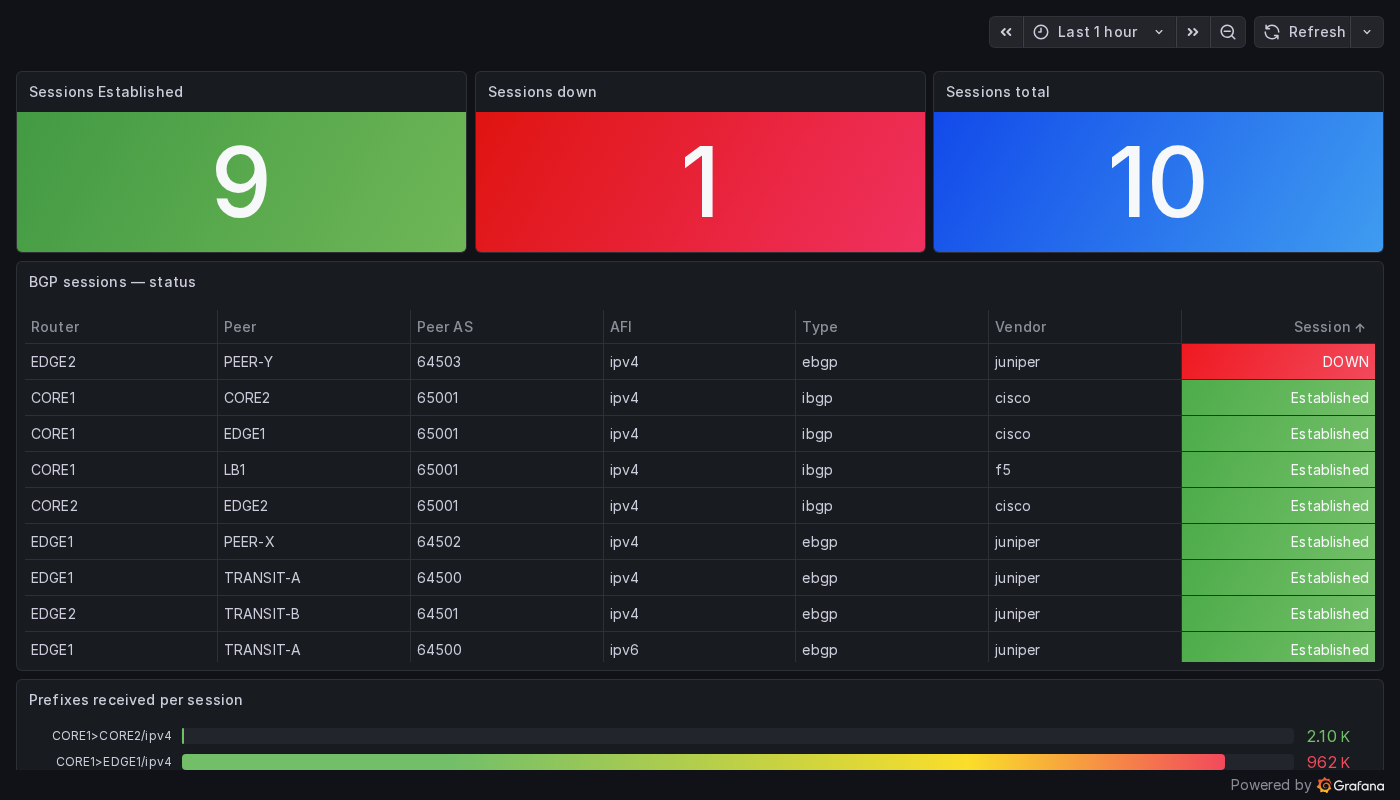
- BGP Fleet Overview — Established / down / total counters, a one-row-per-session status table (DOWN sorted to the top), and a prefixes-received bar gauge (transits near their limit turn red).
- BGP Session Detail — per-router state, prefixes, uptime, and flaps, reached by clicking a node on the map.
Starter kit
Everything above — recording rules, snmp_exporter generator modules, and the
three importable dashboards — is in
tools/bgp/.
Try it live on the testing stack:
WAN Demo — BGP Neighbor Map, … BGP Fleet Overview, … BGP Session Detail.